Are Whole Life Insurance Rates by Age Charts the Best Way to Compare Policies in 2026?


When you look at whole life insurance rates by age charts, what’s the first question that pops into your head?
It’s usually something like, “Are these numbers real for someone like me, or is this just another sales trick?”
In 2026, whole life premiums are higher than term life because the coverage can last your entire life and may build cash value. National data still shows whole life costing several times more than term for the same death benefit, especially from age 50 and up.
But if you only look at a rate chart without context—health, underwriting class, smoker status—you can walk away with expectations that don’t match what any real carrier will approve.
In this guide, we’ll break down how whole life pricing really works, show sample whole life insurance rates by age charts for common coverage amounts, and walk through how to read any chart without getting burned. By the end, you’ll know whether whole life fits your goals—or whether a different strategy makes more sense.
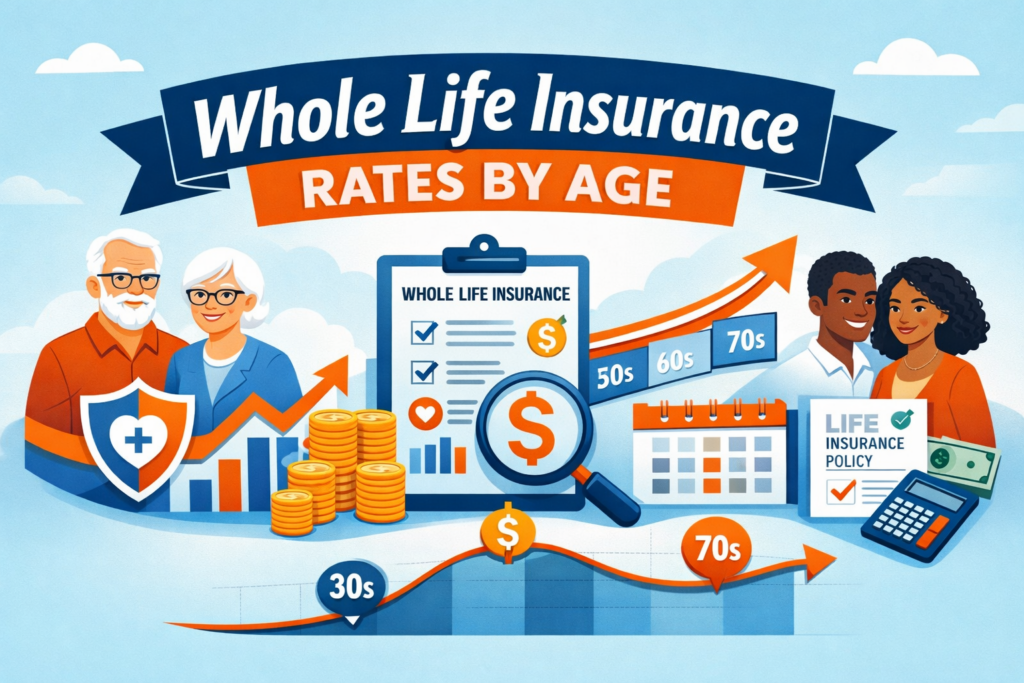
What are typical whole life insurance rates by age in 2026?
In 2026, whole life insurance rates rise sharply with age. A healthy 30-year-old might pay around $150–$250 per month for $250,000 of coverage, while a healthy 50-year-old may pay $300–$500, and someone in their 60s can easily pay $500–$900 or more for the same amount, depending on health and the insurer.
What Do Whole Life Insurance Rates by Age Charts Actually Show
Whole life insurance rate charts are simply snapshots. They display sample premiums for a specific age, coverage amount, and health profile, typically assuming a healthy, non-smoking individual. Many charts now group ages into bands (30s, 40s, 50s) and list sample premiums for $100,000, $250,000, or higher coverage amounts.
What they do not show is your exact offer. Carriers still underwrite case-by-case based on your health, medications, build, and lifestyle. Charts are there to set expectations and help you see how fast whole life prices rise as you age.
Always match the chart to the *same* coverage amount, health class, and payment style. If any one of those changes, you are not comparing apples-to-apples.
Quick checklist before trusting a chart:
- Coverage: $50K vs. $250K can change pricing structure and carrier fit.
- Class: Preferred vs. Standard is often the biggest swing.
- Pay type: Whole Life vs. 20-Pay is not the same product.
- Gender + age band: a 40 vs. 45 chart row matters more than people think.
How Whole Life Insurance Rates by Age Are Calculated
Before you stare at any whole life insurance rates by age charts, it helps to know what drives the numbers behind the scenes.
Whole life pricing starts with mortality tables—actuarial estimates of how long people live at each age. From there, the insurer layers in administrative costs, commissions, reserves, and any guarantees (cash value growth, dividends, paid-up options).
Why age and health move whole life insurance rates the most
The older you are when you apply, the fewer years the company expects to collect premiums and the sooner it expects to pay a claim. That is why a 60-year-old buying whole life pays dramatically more than a 30-year-old for the same coverage amount. Add health issues—diabetes, cardiac history, tobacco—and the carrier prices in extra risk.
A simple rule: if you think your health is “average or better” for your age, you have a shot at preferred or standard rates. If your history is more complicated, your rate will sit near the higher end of the chart or require a smaller face amount.
How coverage amount and policy type change the rate chart
Most whole life insurance rate charts by age focus on level-pay whole life: premiums stay fixed for life. Some show limited-pay designs (10-pay, 20-pay) where you pay more now but finish payments sooner.
Larger death benefits do not move the premium in a straight line. Going from $250,000 to $500,000 usually does not double the premium; the per-dollar cost often falls slightly on bigger policies because fixed fees are spread across more coverage.
Pre-Approved Quote
Complete a short assessment so we can shop you properly and email your best option.
*Have a Pre-Approved, FULLY SHOPPED rate emailed to you — 100% ACCURATE!Sample Whole Life Insurance Rates by Age Charts (2026 Examples)
These examples are not quotes. They are realistic 2026 ranges for healthy non-smokers based on multiple industry rate studies. Actual offers will depend on carrier underwriting and your health profile. The rates below will be for Simplified Issue Whole Life (Final Expense/Burial Insurance) and Traditional Whole Life.
Final expense whole life insurance rates by age for $5,000 to $50,000 of coverage
Many people use smaller whole life policies strictly for burial and final expenses. Those policies use different underwriting and smaller face amounts. These types of policies are simplified and have instant approval and activation within minutes.
It is important to understand the difference between “No Questions Asked” policies like Colonial Penn’s 995 plan (Rate Chart), which has a 2-yr waiting period and a Level immediate policy where you need to answer a few questions. Prices are drastically different. You will save thousands of dollars over the life of the policy just by answering questions.
Here are samples of both male and female of a healthy non-tobacco user, with comparison of Level (Immediate Coverage) and Guaranteed Issue (2yr waiting period):
At older ages, final expense whole life can still make sense, but you should compare the premium to how much cash you already have set aside for funeral costs.
Ballpark quote vs. fully shopped pre-approval
If you want speed, start with a quote. If you want accuracy, complete the assessment so your best option is shopped correctly.
*Ballpark Quote | *Have a Pre-Approved, FULLY SHOPPED rate emailed to you — 100% ACCURATE!
What you get
- Cleaner pricing based on age, health, and coverage amount
- Less guessing, less overpaying
- Simple next steps with a clear plan
Whole life insurance rates by age for $100,000 to $250,000 of coverage (2026 ranges)
For adults who want long-term protection or estate planning, $250,000 is a common starting point. Here’s a simple rate-based chart, also with cash value after 20yrs:
Before the chart, remember one thing: a “range” means you might sit at the low end with excellent health and the right carrier—or closer to the high end if your health or build isn’t perfect.
Chart “jumps” usually come from age bands and underwriting, not random pricing. Knowing the trigger helps you avoid buying at the wrong time.
Common reasons you’ll see a noticeable increase:
- Age band changes: rates often step up at 35/40/45/50/55/60.
- Risk class shifts: BMI, blood pressure, labs, meds can move you to a higher class.
- Face amount thresholds: higher coverage can trigger stricter underwriting.
- Product choice: 20-Pay can cost more monthly but may build cash value differently.
People Also Ask About Whole Life Insurance Rates by Age
These are the kinds of questions that show up in SERPs when people research whole life insurance rates by age charts. Each answer is written in snippet-ready format.
Yes. For the same death benefit, whole life almost always costs several times more than term life at every age because it is designed to last for your entire lifetime and may build cash value. Term life is cheaper because the coverage ends after a set period.
Rates jump after 50 because the company expects fewer premium-paying years and a higher chance of paying a claim during the policy’s early decades. Health issues, medications, and build also become more common, pushing many applicants into higher risk classes.
Most traditional whole life policies have level premiums that never increase as long as you pay on time. Some designs allow you to pay for a limited period, but once the policy is paid-up, no more premiums are due and coverage continues.
Yes. Many carriers issue new whole life policies into a client’s 70s, and final-expense versions may go even higher. The trade-off is price: premiums are much higher, and coverage amounts may be smaller compared to what you could buy in your 40s or 50s.
Most charts only show the premium, not the projected cash value. Some carriers provide separate illustrations that show guaranteed and non-guaranteed cash value over time, but those are more detailed than public marketing charts.
Factors That Can Change Whole Life Insurance Rates Even at the Same Age
Two people the same age can see completely different rates on a whole life insurance rates by age chart. Here’s why.
First, health history and medications matter. Someone with clean labs, no hospitalizations, and a healthy build can land in a preferred class. Someone else the same age with diabetes, cardiac history, or nicotine use might only qualify for standard or table ratings.
Second, policy design changes the premium. Limited-pay whole life (such as 10-pay or 20-pay) packs all the funding into fewer years, so the monthly cost is much higher than standard level-pay whole life—but you stop paying sooner. Riders, such as long-term care or chronic-illness benefits, also add cost.
Finally, carrier selection matters. Some companies price very competitively for younger ages and smaller whole life policies. Others are geared toward high-net-worth planning or complex business needs. That’s why whole life insurance rate chart by company is a better comparison tool than any single generic chart.
Whole Life Insurance Rates vs Term Life Rates by Age – Which Chart Should You Trust?
Before you commit to whole life, it’s smart to compare whole life insurance rates by age to the term life equivalent.
Term life charts usually show very low premiums for 10-, 20-, or 30-year terms and much larger death benefits—for example, $500,000 or $1 million in coverage for a fraction of the cost of whole life.
If your primary goal is to protect income while kids are at home or a mortgage is in play, 30 year term life insurance cost may be the more relevant chart. If your goal is long-term estate planning, funding a trust, or guaranteeing money to pay final expenses, a whole life rate chart makes more sense.
In practice, many families blend both: a term for big temporary needs and a smaller whole life policy for permanent obligations.
How to Read Whole Life Insurance Rate Charts Without Being Misled
A rate chart is a tool, not a promise. Here’s how to keep it honest.
Start by checking the fine print: what age, health class, and smoker status does the chart assume? Many online charts quietly assume “preferred non-smoker,” which only a portion of the population qualifies for. Then look at coverage amounts. If you see unrealistically low premiums for large face amounts, you’re probably looking at term life or a teaser rate, not true whole life.
Next, use the chart as a reality check, not a shopping cart. If a chart shows a 50-year-old paying around $400 per month for $250,000 of whole life, and your quote comes back at $950, that’s a sign your health, build, or policy design is very different—or that the agent is pushing bells and whistles you don’t need.
Finally, consider your bigger plan. A chart can’t tell you whether whole life is the best way to hit your goals. That’s where a real conversation with a specialist comes in, especially when you’re weighing high net worth life insurance planning or complex business coverage.
Use charts to set expectations—then confirm your exact class with a quick risk review. Charts are ballpark. Underwriting makes it real.
Best next step (simple):
- Step 1: Pick your age row + coverage amount from the chart.
- Step 2: Confirm tobacco status + meds + basic health history.
- Step 3: Shop carriers to isolate the best rate class for your profile.
- Outcome: Best price, correct product, no surprises.
Related Articles
FAQs About Whole Life Insurance Rates
These FAQ questions are different from the PAA set and focus on next-step, high-intent concerns.
From a pure pricing standpoint, earlier is almost always better. Buying in your 20s or 30s lets you lock in lower premiums for life. But the right time is when you actually have a permanent need—final expenses, estate planning, or long-term obligations you know will outlive your mortgage and kids’ dependency years.
You generally can’t “negotiate down” a whole life premium after the policy is issued, but you may be able to reduce the death benefit, switch to a paid-up status, or use cash value to offset premiums. Those moves should be reviewed carefully so you don’t damage long-term guarantees.
Most public charts assume non-smokers. Smokers—especially daily cigarette users—can pay 50–100% more for the same whole life policy. If you use nicotine in any form, you need charts or quotes that clearly show smoker classes.
Start with apples-to-apples comparisons: same age, same death benefit, same premium pattern (level-pay vs 10-pay). Then look at each carrier’s financial strength, guarantees, and flexibility. A slightly higher premium from a stronger company with better options may be the better long-term deal.
Final expense charts focus on smaller coverage amounts, usually $5,000–$50,000, and relaxed underwriting. They’re most useful if your main concern is funeral and small debt coverage. If you have a mortgage, business, or estate-tax concerns, you’ll want to look at larger coverage charts as well, such as burial insurance rates by age and Mutual of Omaha life insurance rate chart.
Final Thoughts: How to Shop Whole Life Insurance Rates by Age the Right Way
If you’ve made it this far, you already know one thing: whole life insurance rates by age charts can be helpful, but they don’t tell the whole story.

The real question is, “What am I trying to protect, and for how long?” If the answer is permanent—final expenses, legacy money for family, estate-tax liquidity, or long-term business needs—then a carefully structured whole life policy can be a powerful tool. If the need is temporary, term life or a blend of term and whole life may give you more coverage for less money.
You don’t need sugar-coated numbers or teaser charts. You need clear math, straight talk, and a plan that actually fits your life.
Ready to see real numbers — then lock in the right structure?
Get a Quote: Start with a simple whole life and term comparison so you can see real numbers by age, health, and coverage amount.
Get a Quote
Start with a simple whole life and term comparison so you can see real numbers by age, health, and coverage amount.
Get a QuoteCall
Talk through your goals with a licensed advisor who lives in these rate charts every day and can help you avoid overpaying.
Call 855-380-3300Schedule a Call
Book a time that works for you to walk through your options, your underwriting profile, and how to structure coverage so your family and business are protected.
Schedule a CallNote: If you want the most accurate outcome, complete the pre-approval assessment earlier in the page so we can shop properly before you apply.
More Resources